IntraManager Board
easily showcase your
Contact center’s data
Get started quickly with data visualization and take control of your contact center – completely without the frustration with difficult, mathematical formulas.

Keep yourself updated
Show your data live across your tools and gain valuable insight into the performance of your contact center and your employees. With IntraManager Board you can be proactive, as the tool lets you spot trends and respond quickly.
show the data quickly
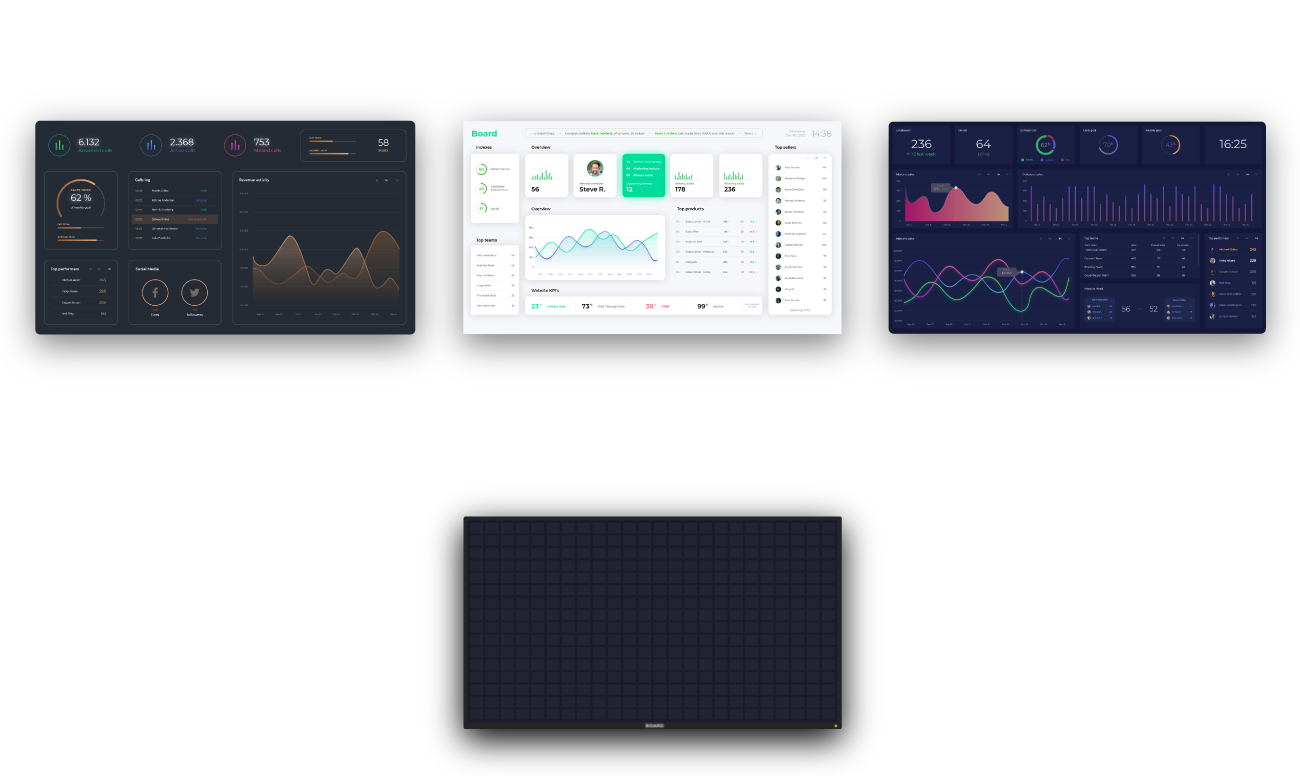
Get started quickly with data visualization in your contact center. You can either use our cool templates or build your board with our smart widgets. Once you have set up your board – whether you have built it yourself or used the templates – the data is automatically displayed. The visualization of your data creates an overview, improves the performance of your employees and ensures the progress of your contact center.


Great opportunity for customization
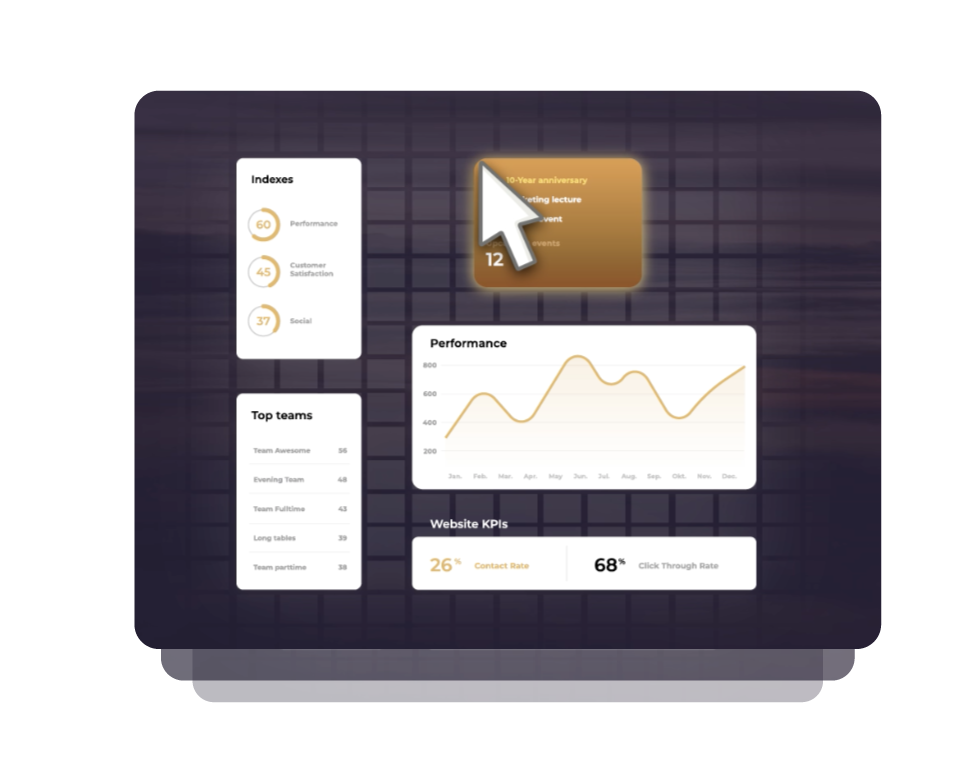
Customize your boards to match the visual identity of your contact center. You can either use the built-in themes or create your very own theme based on the colors already being used in your contact center.
Create your own KPIs

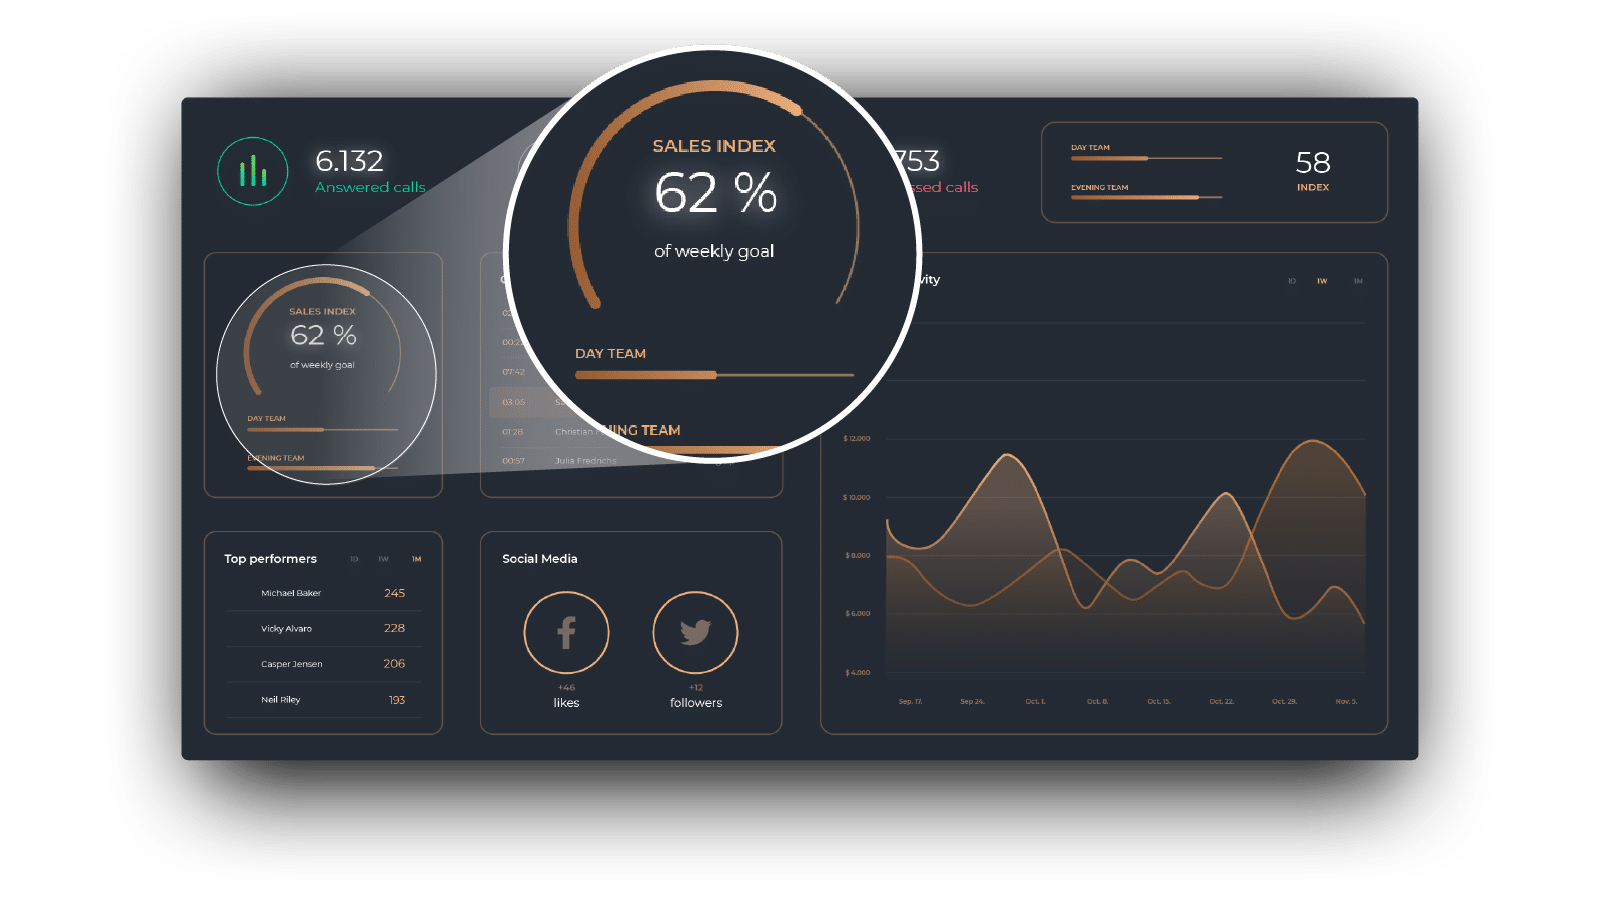
Integrate with your tools and access the built-in KPIs. If these KPIs are not enough for your contact center, you can also create your own custom KPIs. It allows you to view and follow exactly the KPI you want.
Display live data and
improve performance
Try IntraManager Board free of charge for 30 days and experience the benefits of visualizing your contact center's data and performance yourself. The trial period is non-binding and the only thing we need from you is your e-mail and phone number.


